After last week’s post on promise and perils of big data, I wanted to pursue the discussion further around data quality. This is usually covered by “veracity and validity” as additional “Vs” of big data. In my experience, these two really go hand-in-hand and speak to the issue at the heart of driving business value leveraging big data. If users are not confident in the data quality, then it doesn’t matter what insights the system delivers as no adoption will occur.
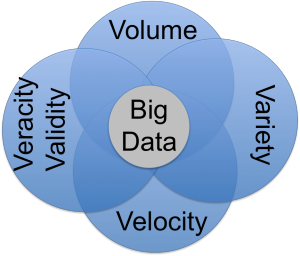 Merriam-Webster defines something as valid when it is “well-grounded or justifiable: being at once relevant and meaningful; logically correct.” Veracity is defined as “something true.” In the big data conversation (as found on insideBIGDATA, veracity refers to the biases, noise and abnormalities found in data while validity refers to the accuracy and correctness. At it’s core, the question of data quality comes down to whether they data you have is reliable and trustworthy for making decisions.
In a Jan 2015 article on big data veracity, IBM speculated that uncertain data will account for 80% of your data. The author Jean Francois Puget said that 80% of an analytics project is comprised of data cleansing. I whole-heartedly agree that 80% of data analytics project time should be spent on data cleansing. Unfortunately, in my experience, the project urgency and promise reduce this time significantly.
While the reality might be slightly alarming, I think there are steps in the process that can minimize data quality issues.
- Make sure the team understands the business problem – How can you know what data you need, if you don’t understand the business problem? Further, how can you know if your data is accurate or true for solving the business problem? All data analysis and quality checks should become obvious once the project team gets grounded in the business problem.
- Map out the data needed to solve the business problem – Once you understand the business problem, you can start to map out the data you need to solve it. You’ll want to consider how the data will be sourced. Data obtained from outside your sphere of influence (department, organization, etc) may require additional manipulation and cleansing to get to a usable state.
- Analyze your source data – Even if you are comfortable in the data source, you will still want to do some analysis once you start receiving data. Just because documentation says something is true, does not make it so. Values may be different than expected, which could have significant impact on your model or visualization.
- Make decisions about the business rules – It is very rare for data to be usable without any manipulation or cleansing. In response to steps 1-3, decide how the data needs to be manipulated.
- How should the specific business rule be applied (i.e. fill in gaps with average of last 10 records)?
- When will the business rule run (i.e. at what step of the process)?
- Who, specifically which system, is responsible for applying the business rule (i.e. Is it the source system? Is it an intermediary system (like Mulesoft) that feeds the data to you? Is it the data load process? Or is it a post load process?)
- Clearly document & get sign off on everything captured above – Leveraging big data to deliver business value is hard. Documentation acts as a reminder of what was done and why. It should clearly define the problem, the data, the sources, the business rules as well as the confirmation that the project team and audience agreed to the path taken.
During my projects, I spend a lot of time around data analysis. As the project manager I want to fully understand the data, and I want confidence that it is correct and reliable. It’s this same effort that needs to be taken with the project stakeholders and end users to given them a comfort level. Each step of the process of validating assumptions are proof points for building trust. It is trust that will yield adoption.