It really isn’t all about the numbers

Sitting at the intersection of business and technology means that I can interact with both groups. As a project manager who specializes in data projects, this often means diving into the analysis of the data, for validation, or understanding requirements, or more importantly to help craft a story, preferably around project success. Companies are becoming more data savvy, hiring Chief Data Officers and data scientists, and focusing on numbers to drive business decisions. I am very supportive of this, but we need to be careful to remember that it’s not just about the numbers.

numbers

More important is how we use these numbers to tell our stories. If your customer presents you with a problem, and a set of data that supports their conclusions, you need to look at it end to end to determine how to approach your story. Here’s a few thoughts on how you might approach it.

  • What were the assumptions made? In lieu of other information, we start with a core set of assumptions. It’s good to recognize and document these assumptions. It’s also good to challenge the assumptions if you have information not previously considered.
  • Evaluate your inputs end to end. Start at the beginning of the process and evaluate each step to understand the decisions made, and how those decisions impacted the outcomes.
  • Evaluate the outputs. There are so many opportunities to introduce uncertainty and inaccuracies into human process (data or otherwise). Was the data entry manual? Is there evidence of irregularities? Does the output make sense in relation to the logic of it’s corresponding process? Systematic logic is still at the whims of the people who write it.
  • Challenge the conclusion. While it’s important not to be defensive here, you do need to consider the “foregone conclusion”  and make sure it withstands probing and prodding. This is where perspective and point of view comes in. Make a conscious determination of the story you are telling based not the facts.
  • Communicate the deficiencies. If you go from one extreme to another extreme, swapping the entire frame of reference, it raises questions and credibility issues. As you are diving in and crafting your story, make sure to highlight deficiencies and inefficiencies of all components. Try to be balanced in your analysis, taking into account the work your customer took before it came to you.

There are lots of methodologies being used for diving in to real root causes (i.e. 5 whys, fishbone, etc). In data projects, it’s about being able to understand what the data is telling you and being able to convey that in a coherent and concise manner. Please don’t give me a bunch of facts, without an explanation of how you got there. This is the story. Understanding that data needs explanations, in the form of stories,  is why I do so well in managing my data projects.

2016 Retrospective

Like many of you, the start of another calendar year made me think about what I accomplished in 2016 and what my goals are for 2017. Overall 2016 was a good year. I worked on some interesting projects, and was able to spend some time working on the business too. I’m going use this post to share 4 key observations around data analytics and business intelligence as it relates to the data integration projects I managed last year.

  1. Projects were cross data more than any time before – It used to be that a data integration project was very specific and limited in scope to single sets of data. Sometimes this happened as a result of trying to solve a very specific problem, or the specific team paying for the implementation. But this year, all my data integration projects were done at a higher level covering multiple sources. People and businesses are leveraging different data points/sources more than they ever have before.
  2. People want self service tools to cover all scenarios – Traditionally, organizations had specific roles or departments that handled data analytics. A big reason for this was the level of expertise required to mine data (databases, programming languages, etc). The increase and implication of self services business intelligence tools have enabled many more people to participate. Unfortunately there is still a level of expertise required to master these tools. We are starting to see the impact of this with users believing the single tool or skill they invested in will solve all their data analytic questions. But that’s not the case. Using the wrong tool for the job, or trying to get a single tool to cover all scenarios often results in frustration all the way around.
  3. There’s a lot still to learn about data quality – In every data integration project I have managed, there has been an epiphany moment with the customer where they realize the data isn’t as clean as they thought it was. This might be as simple as have gaps in data where you thought it existed, but it can also extend to data mistakes, duplication, missing relationships, etc. Nobody wants to hear that there are issues with the data having been used for years. However, projects where the stakeholders have an open mind and treat the project as an opportunity to remedy some of these issues are often more successful. Vendors and project teams need to work closely with the customer to ensure proper documentation and root causes are identified to the best of our abilities.
  4. Flexibility is key – We are still working in times of very tight purse strings, but needing to move very quickly to respond to current and future market signals. For businesses to succeed, the organization needs to be working at optimal performance and be able to flex with the client needs around product, services, payments, etc.

What were your key take-aways from your projects in 2016? Without reviewing where we came from in our projects and operations, how can make the next initiatives more successful than the last?

Semi-homemade is better than bespoke for data analytics

I read a product review this week where the company referred to themselves as a provider of “bespoke” data analytics. I had never heard that term used in the context of data analytics, or software specifically. However, when I googled the term, I found many companies using it in their marketing language, but no reference to it by the people who write about data analytics or software. This led me to start thinking about my experiences managing data integration software projects and how my customers view the solutions.

The projects that I’ve worked on in the last couple of years have primarily been data integration projects where we are combining multiple datasources into a single data warehouse and then leveraging that data to deliver data insights. The platform has some standard integration components that you can leverage, but there is also room for quite a bit of custom development. In every implementation, I have had conversations about what “standard” tools are available and what capabilities can be developed custom. On one hand, once these customers start reviewing the available tools, the first questions asked are usually about how we can customize those tools to their business. Each customer self-identifies as a unique even though most are within the same overall industry. There are always unique scenarios for each customer that needs to be accounted for.

bespoke-suit-pattern

http://www.giandecaro.com/img/background-bespoke.jpg

On the other hand, customization takes time and effort, regardless of whether the work is done in house or by external consultants. Where does that leave us if our customers want/need something specific to their business but don’t want or can’t invest the time and money to do so?

I think as integration partners, we are probably looking at the entire product management and implementation process incorrectly. Our customers need a balance of standard tools that they can quickly customize to their specific needs along with partners who will work with them to develop custom solutions for new or innovative work. This is similar to the idea of leveraging a template to develop your website, but then be able to customize your experience by changing colors or adding widgets that extend the template capabilities. We can think of these types of products as “semi-homemade.”

Semi-homemade is a term used heavily by Sandra Lee regarding her cooking style. She leverages pantry staples and other ingredients and creates amazing dishes. By not having everything made from scratch, Sandra Lee reduces the cooking & prep time but is still able to deliver tasty dishes people want to eat. If we apply the same principles to data analytics, I think we can definitely leverage some basic tools that we allow people to extend or meld, which result in delivering data insights without the pain of everything being a custom solution.

It’s time to shift our mindset away from solely developing out of the box solutions, or solely developing custom solutions. Product and services should be working together to build base tools that are easily extended to meet the changing needs of our customers. We won’t totally eliminate the need for custom solutions, or new products for that matter. But we will more quickly be able to meet the changing needs of our customers.


Data Quality: The Heart of Big Data

After last week’s post on promise and perils of big data, I wanted to pursue the discussion further around data quality. This is usually covered by “veracity and validity” as additional “Vs” of big data. In my experience, these two really go hand-in-hand and speak to the issue at the heart of driving business value leveraging big data. If users are not confident in the data quality, then it doesn’t matter what insights the system delivers as no adoption will occur.

4vs_big_dataMerriam-Webster defines something as valid when it is “well-grounded or justifiable: being at once relevant and meaningful; logically correct.” Veracity is defined as “something true.” In the big data conversation (as found on insideBIGDATA, veracity refers to the biases, noise and abnormalities found in data while validity refers to the accuracy and correctness. At it’s core, the question of data quality comes down to whether they data you have is reliable and trustworthy for making decisions.

In a Jan 2015 article on big data veracity, IBM speculated that uncertain data will account for 80% of your data. The author Jean Francois Puget said that 80% of an analytics project is comprised of data cleansing. I whole-heartedly agree that 80% of data analytics project time should be spent on data cleansing. Unfortunately, in my experience, the project urgency and promise reduce this time significantly.

While the reality might be slightly alarming, I think there are steps in the process that can minimize data quality issues.

  1. Make sure the team understands the business problem – How can you know what data you need, if you don’t understand the business problem? Further, how can you know if your data is accurate or true for solving the business problem? All data analysis and quality checks should become obvious once the project team gets grounded in the business problem.
  2. Map out the data needed to solve the business problem – Once you understand the business problem, you can start to map out the data you need to solve it. You’ll want to consider how the data will be sourced. Data obtained from outside your sphere of influence (department, organization, etc) may require additional manipulation and cleansing to get to a usable state.
  3. Analyze your source data – Even if you are comfortable in the data source, you will still want to do some analysis once you start receiving data. Just because documentation says something is true, does not make it so. Values may be different than expected, which could have significant impact on your model or visualization.
  4. Make decisions about the business rules – It is very rare for data to be usable without any manipulation or cleansing. In response to steps 1-3, decide how the data needs to be manipulated.
    1. How should the specific business rule be applied (i.e. fill in gaps with average of last 10 records)?
    2. When will the business rule run (i.e. at what step of the process)?
    3. Who, specifically which system, is responsible for applying the business rule (i.e. Is it the source system? Is it an intermediary system (like Mulesoft) that feeds the data to you? Is it the data load process? Or is it a post load process?)
  5. Clearly document & get sign off on everything captured above –  Leveraging big data to deliver business value is hard. Documentation acts as a reminder of what was done and why. It should clearly define the problem, the data, the sources, the business rules as well as the confirmation that the project team and audience agreed to the path taken.

During my projects, I spend a lot of time around data analysis. As the project manager I want to fully understand the data, and I want confidence that it is correct and reliable. It’s this same effort that needs to be taken with the project stakeholders and end users to given them a comfort level. Each step of the process of validating assumptions are proof points for building trust. It is trust that will yield adoption. 


Teaching data science to my teenage daughter

Note: This post is a bit long, but it’s the story behind the evolution of our project to teach data analytics and data science to a teenager, leveraging her love of ice hockey.

There are a few times during my career where I have made decisions, that were in retrospect, a lot better for my family than I initially thought. At the time I made the decision, I did weigh the impact of the decision on my family, but there have been 2 that were really the best things that could have happened. The first was back in 2011 when I quit my job. My younger daughter was struggling in school and having the time and flexibility to get her the help she needed would have been extremely difficult if I had been working the schedule I had been. The second happened recently. In March I left another job to join my husband in the full-time running of our business. Since March, I’ve been able to spend one-on-one time with each of my daughters, taking separate spring break trips. And more importantly (at least for this post), I was able to work with Cayla, our 16 year old, during her summer internship project.

This story begins when we decided in the spring that we were going to hire Cayla as an intern in Digital Ambit, our software and data integration consulting business. At the time we knew we wanted to use this time productively, specifically we hoped to teach Cayla some technical skills. The most obvious route would have been to have Carson teach her programming. However, Carson was more than 100% utilized in our consulting business, where I had a bit more available time working on the business. We needed to be able to get Cayla some tech skills, without severely impacting Carson’s ability to deliver on our billable work. This left me to figure something out.

My background is fairly diverse, with time spent in both technical and software skills. I consider myself a technical project manager, truly leveraging my technical skills to manage customers and projects. While I can manage any technical project or implementation, my actual technical experience focuses on databases and data management. I had recently taken some data science Coursera courses and had dipped my toe in the R world. I finally decided Cayla was going to do a data analytics/science project to take hockey statistics and see if she could predict who will win next year’s Stanley Cup.

I bought Cayla a couple of books on data science for business and practical data science with R. I knew Cayla had never studied statistics and had a few concerns about the complexity of resources written about data science and R. I made Cayla write a blog to make sure she could articulate the material she was learning. Once she started picking up some of the basics, we talked through the project at a very high level so Cayla knew what the next steps were. This was very much a hands on project for her. She had to find the data, download the data, cleanse the data, and figure out the R syntax to load and analyze the data. I gave her space to work through issues, especially after the first few times she told me she had an issue with R and after asking if she had confirmed the syntax, pointing out the missing comma or syntax error.

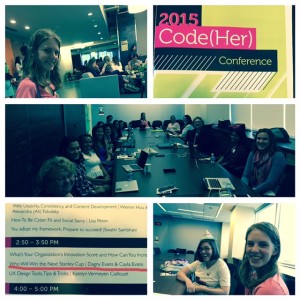
We were about a month into the project before Cayla could bring all the pieces together and really explain what she was trying to do. She could relate the daily work to the project, and had mapped out her next steps to align to her business question (“Who will win the next Stanley Cup?”). At this same time, we learned we had been accepted to present this story to the DC Web Women Code(Her) conference. This intensified the pressure, and added a hard deadline of September 12, 2015.

This is where it got a bit difficult for Cayla. At this point she had gotten all the data she thought she needed, cleansed it (or so she thought), and had found  at least one way to calculate the historical means, and populate the 2015-2016 statistics. The complex nature of the statistical models and the applicable documentation caused this to be a real sticking point for Cayla. Unfortunately, the method she had been using, along with her still dirty data made reproducibility and data modeling extremely difficult.

At this point, I stepped in to help in a more hands on way. I knew that I wanted to create an R script to share during our presentation, so I started walking through Cayla’s syntax. Sometimes things that work in isolation, don’t work the best when combined with the other methods you applied. It took some intense focus to step through the process, cleanse the data to acceptable R processing standards, and leveraging different syntax for historical means and filling gaps. The hardest part was finding clear, concise examples of people who had done this before. Ultimately, I was able to find syntax that worked to run models against the data and analyze the data. We were not successful in getting the model to predict any winners.

I think Cayla and I both learned a lot from this project. Cayla learned that she can do really hard things, she’s never done before. Cayla also learned about planning and organizing data projects, and how truly difficult, but incredibly important, it is to clean your data. I learned that Cayla can learn anything with the right incentive, or within the framework of something that interests her. I also learned that in data analytics and science, more people need to publish their work in simpler forms. Please don’t assume everyone has a PHD.

We presented our story at the Code(Her) conference on Saturday. Cayla reinforced her knowledge of data science during the Intro to Machine Learning session, and seemed to have fun learning agile principles while playing games. The day culminated with us presenting to a room full of women. It was really rewarding to see how well Cayla did, and to see how many wanted to hear us.

IMG_0396

To see our detailed presentation and additional materials, visit my github page.

Isn’t it just data?

There is a prevalence of news on “big data”. Almost every day, there is another story about how you can benefit from it. Despite all this, most people do not understand what “big data” means. This has resulted in my complete dislike for this term. Businesses have business questions and data. As businesses grow, they collect more data and the business questions change. This means that different methods are used for storing and managing the data; extracting and cleansing the data; and then analyzing and delivering the  results. Does it really matter if it’s “big?”

“Big data” is often defined by large volume, high velocity and wide variety. There’s no doubt that the increases in volume, velocity and variety of data has introduced new technologies and methodologies. These are not right for all businesses in all circumstances. In order to make the right choice, It is very important for businesses to understand:

  • how much data they have?
  • how quickly their data grows?
  • how much data variety exists?
  • what business questions are they trying to answer?

Once businesses have an understanding of what they have and what they want to accomplish, they can then start focusing on the tools and methodologies for leveraging what they have to get to what they need. Another consideration at this time is determining whether the tools that fit best for today are short term solutions, or whether they will grow with the business as the business needs change.

While I believe that “big data” is an overused term that many don’t really understand, I am a big supporter of businesses becoming more data driven. In order for this to be a success, businesses will need to know what they have, where they are going and what they are looking for. They will also want to evaluate the abundance of data storage, extraction, cleansing and analysis tools to determine which work best for them.